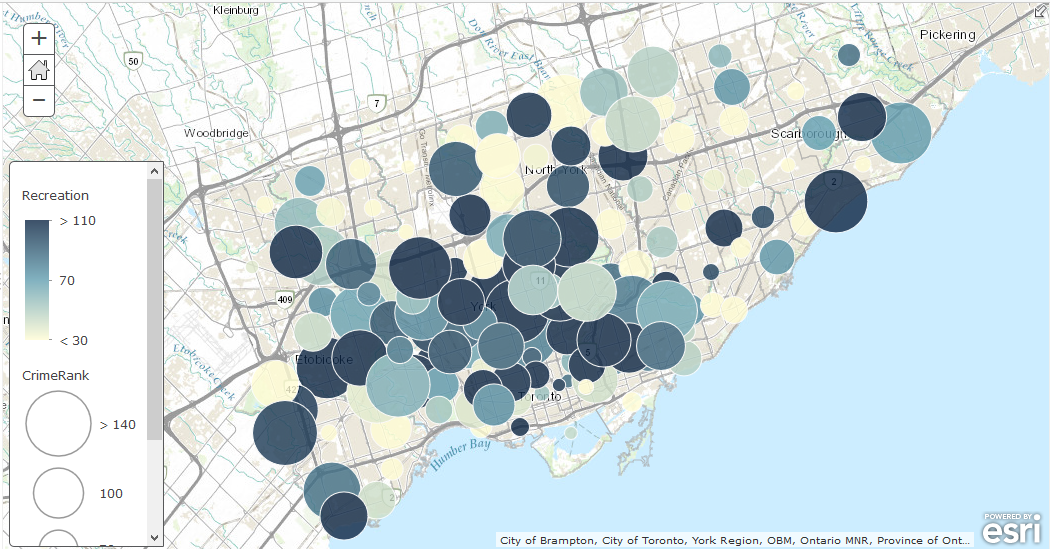
During a 40 hours hackathon at YHACK16 Yale University, I, along with a team of two, built an interactive graphic map highlighting Toronto’s neighborhood. By giving the power of big data visualization to users with the tools to directly control the data, which helps them understand the analytics for each neighborhood, identify new patterns issues and find their future home.
I worked on the data science behind this project, by utilizing Open Data Toronto, we used crime rate, environmental, demographic, and economic data of each neighborhood in Toronto, gave it a rank using using Gaussian Distribution
Team members: Stephan Arulthasan, Muhammed Usman